Temple TX Real Estate Investment Market
Investor-grade market intelligence for the Temple-Belton, TX corridor. Cap rates, rent yields, supply pipeline, demand drivers, and risk factors — sourced, dated, and updated.
Temple-Belton, TX is a balanced, cash-flow-optimized investment market as of August 2026. With about 4.6 months of housing inventory, a median sold price of $261,545 (264 closings in the August 19 CTXMLS export), and gross rental yields of 7.1%–7.6%, the market offers materially stronger cash-flow math than Austin ($557K city median, roughly 3.5%–4.5% yields) or DFW at roughly half the entry cost. Demand is structurally insulated by Baylor Scott & White Health (8,884 employees), Fort Hood (45,000+ active-duty), and Meta’s $1.2B+ Temple data center, which went live July 22, 2026. However, investors must rigorously underwrite for Texas-level insurance premiums (up 57% since 2015) and aggressive property tax assessments to protect actual cash flow.
- Median sold $262K (Temple) / $305K (Belton) — entry cost less than half of Austin’s $557K
- Gross yield 7.1%–7.6% (Temple); 5%+ is an acquisition target, not a measured neighborhood cap
- 4.6 months inventory — and 56% of active Temple listings have already cut price
- 3 recession-resistant demand anchors: healthcare, military, tech infrastructure
- MTR strategy has generated $2,400–$3,000/mo on furnished 3BRs near BSW and the data-center corridor
- Primary risk: insurance premiums + property tax burden compressing NOI by 15–25%
How Is the Temple TX Housing Market Performing in 2026?
The Temple-Belton market has completed its post-pandemic correction and settled into a stable, balanced state. Median sold prices sit at $262K (Temple) and $305K (Belton) in the August 19, 2026 CTXMLS export, and trailing-12 medians are flat year-over-year — a structured recalibration from unsustainable 2021–2022 peaks when Killeen-Temple MSA values spiked over 46%, per Texas Real Estate Research Center data. The market is not crashing — it found its floor.
For investors, this correction created the best entry conditions since 2019 — but the negotiating room hides in the listing history, not the closing table. The median Temple closing hits 100% of final list price yet only 96.4% of original list: sellers concede through price cuts before the offer ever arrives, and 56% of active listings have already cut at least once. Median closed days on market is 53 (Temple), enough time for proper due diligence without panic bidding. The headline numbers on this page refresh monthly on the Temple TX market update; this report layers the investor lens on top.
Full Metrics Snapshot: Temple vs. Belton
| Metric | Temple | 1-Yr Trend | Belton | 1-Yr Trend |
|---|---|---|---|---|
| Median Sale Price | $261,545 | ↔ +0.5% YoY | $304,667 | ↔ -0.1% YoY |
| Price / Sq Ft (closed) | $154 | ↔ Flat | $171 | ↔ Flat |
| Median DOM (closed) | 53 days | ↓ 61 → 56 trailing | 43 days | ↓ 60 → 51 trailing |
| Months of Inventory | 4.6 (Temple) · 4.7 (Bell County) | ↓ from 5.3 in spring | ||
| Close vs Final List / vs Original | 100% / 96.4% | ↔ Cuts do the work | 98.6% / 96.4% | ↔ Same pattern |
| Median Rent (3BR SFR, closed leases) | $1,550 | ↔ Flat TTM | $1,772 | ↔ Flat TTM |
| Gross Yield (3BR basis) | 7.11% (all-beds 7.57%) | ↔ Steady | 6.98% | ↔ Steady |
| Cap target (not observed median) | 5%+ acquisition target | Deal-specific | 5%+ acquisition target | Deal-specific |
| Rental Vacancy Rate (spring 2026 est.) | 4.3% | ↔ | 4.8% | ↔ |
Sources: CTXMLS export dated August 19, 2026 (264 Temple / 116 Belton closings, June 22-August 18, 2026); trailing trends from the August 5, 2026 CTXMLS trailing-365 export; lease medians from Bell County MLS closed leases through June 12, 2026; vacancy per spring 2026 RentCafe estimates. Active counts vary between MLS feeds and aggregator platforms due to new-construction shadow inventory.
What Does the Housing Supply Pipeline Look Like in Temple TX?
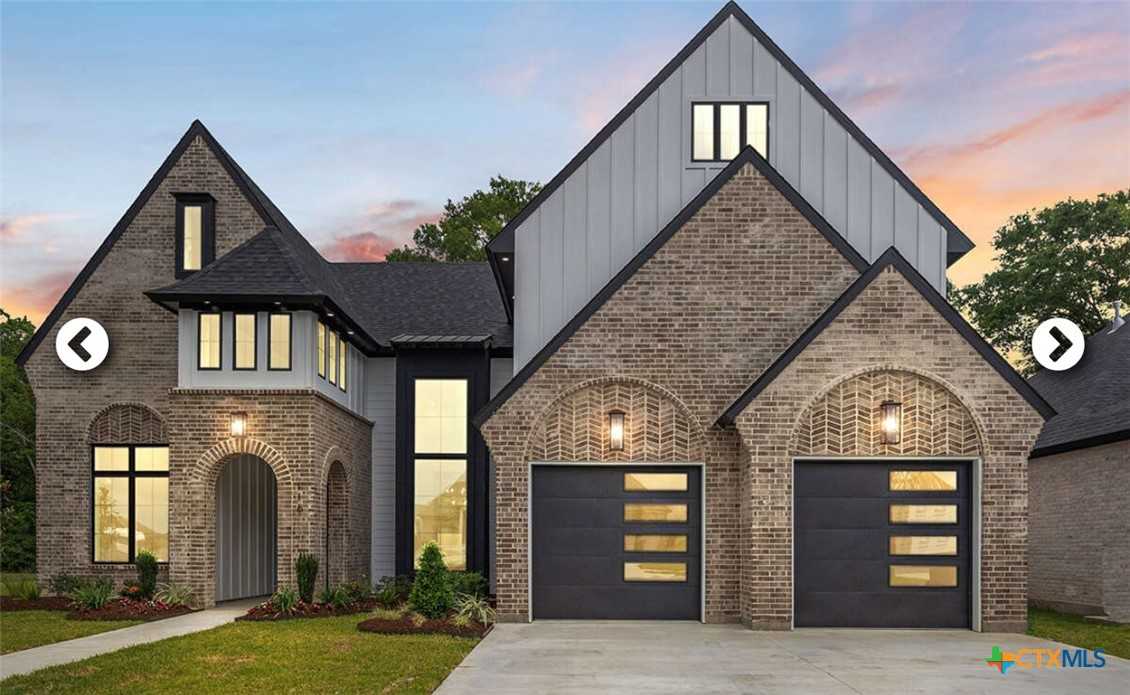
Supply analysis is where most generic market reports fail. They show inventory counts without explaining what is actually being built, for whom, and at what price point. Here is the full picture — pair it with the dated Temple price bands to compare it with recent sales.
New Construction Activity
National builders continue to expand aggressively in the Temple-Belton corridor — the August 5, 2026 CTXMLS pull showed 422 active new-construction listings countywide (YearBuilt 2025+), with D.R. Horton alone accounting for 117. Product targets first-time buyers and investor-grade rentals in the $220K–$340K range. The new construction homes in Temple guide covers dated Temple price bands and builder profiles. Communities named in this report:
- Stylecraft Builders — Northgate: 250+ lots planned in North Temple, starting in the low $200Ks with completion timelines extending into 2027.
- Centex (PulteGroup) — County View: 163 lots in South Temple priced $218K–$290K, with new construction warranty and investor-friendly floor plans.
- Ament Homes — Deer Grove: Targeting the sub-$250K segment in the 76502 corridor, filling the inventory gap for price-conscious buyers.
Multifamily Pipeline: The Contracting Supply Story
This is the most important supply dynamic investors need to understand. Across Texas, apartment deliveries are projected to fall by roughly 50% in 2026 compared to the 2024 peak. Austin deliveries have plummeted 65%. Dallas deliveries are down 40%. Tighter commercial construction lending, sustained high rates, and elevated material costs forced developers to pull back aggressively, per MMG Real Estate Advisors data.
In Bell County, targeted niche projects continue — notably The Belton, a 198-unit 55+ active adult complex ($32M estimated cost) expected to complete by December 2026. But the flood of generic Class-A apartments that was threatening rent growth has stopped. By 2027–2028, the market will likely return to an undersupplied state.
“The single-family market has reached healthy balance. The sharp drop in new multifamily permits filed in 2025 ensures that by 2027–2028, investors who acquire now will benefit from a tightening supply pipeline.”
Temple-Belton MSA Supply Analysis, 2026What Is Driving Housing Demand in Temple-Belton?
The Temple-Belton MSA runs on a uniquely diversified economic engine that does not rely on any single industry. Three recession-resistant sectors — healthcare, military, and tech infrastructure — operate within a 30-mile radius, creating a demand floor that most Texas secondary markets cannot match.
Population Growth: 3.38% Annually
Temple’s 2026 population stands at approximately 103,001, growing at 3.38% per year according to Census estimates. Since 2020, the city has expanded 24.4%. The broader Waco-Killeen-Temple MSA (891,464 residents) is projected to approach 1 million by 2036 based on PopStats demographic modeling. The growth is structural: intra-state migration from increasingly expensive Austin and Dallas continues to push residents toward Bell County’s lower cost of living.
Baylor Scott & White Health: 8,884 Employees
BSW is Temple’s largest employer and a permanent demand floor for rental housing. Key expansion activities:
- $20M logistics distribution center — 100,000 sq ft on 42 acres, creating 40 specialized jobs (City of Temple Economic Development Agreement)
- 45-bed inpatient rehabilitation hospital — joint venture with Select Medical
- Average healthcare job earnings of $75,341/year, driving demand for Class-A rentals and mid-term furnished housing
Fort Hood: 45,000+ Active-Duty Personnel
The military installation remains one of the largest economic engines in Central Texas. Two critical dynamics for investors in 2026:
- 5.4% BAH increase took effect in 2025, directly increasing purchasing power for military families in the private rental market
- 272-unit McNair Village demolition — part of a $420M, five-year on-base housing modernization plan. Displaced families are pushed into the off-base SFR rental market across Belton, Harker Heights, and West Temple
Meta Data Center: $1.2B+ — Live as of July 22, 2026
Meta’s 900,000 sq ft hyper-scale campus went live on July 22, 2026 — a $1.2B+ investment running with roughly 100 permanent operations roles. The first building’s construction surge (1,200+ specialized workers) is winding down, but the corridor’s build-out is not: additional data-center and industrial projects are underway or announced around Temple, sustaining contractor-driven housing demand. The investor read: treat MTR premiums tied to construction as cyclical income, and the operations-era impact as a durable but modest employment base layered on top of the corridor’s growth signal. Full project-by-project breakdown: the Temple data center impact report.
Higher Education & Infrastructure
- UMHB (Belton): 3,321 students with housing policies that push upperclassmen into the Belton rental market
- Texas A&M Health Science Center: Expanding STEM facilities and ambulatory care; partnership with Temple College launching semiconductor training pipeline
- I-14 Extension: TxDOT connecting I-35 in Belton to Loop 363 in Temple, reshaping commercial zoning and unlocking new subdivision corridors
What Are the Key Investor Metrics for Temple TX Rentals?

Macro data means nothing if it cannot be translated into underwriting numbers. This section breaks down the operational metrics that determine whether a deal actually cash-flows.
Rent Growth & Yield Analysis
Rent growth is flat. The Temple 3BR closed-lease median held at $1,550/mo across the trailing year (215 closings through June 2026), while the all-beds median softened about 3% in 2026 year-to-date ($1,650 TTM vs $1,600 YTD). Underwrite new acquisitions on flat rent assumptions for the next 12–18 months. A 5% cap target requires enough net operating income after vacancy, property taxes, insurance, management, maintenance, leasing costs and any HOA dues. The gross yields above do not establish that result. A below-market purchase or value-add strategy may help, but renovation and closing costs must also be tested in the return on total acquisition cost. Buying at a discount does not automatically reduce the county tax assessment.
Cap-rate clarification reviewed September 14, 2026. Cap rate means annual net operating income divided by price or value, before mortgage payments. The underlying market-data dates above are unchanged; these are acquisition targets, not verified neighborhood returns.
| Bedrooms | Estimated FMR | Notes |
|---|---|---|
| Studio | ~$857 | Limited SFR applicability |
| 1 Bedroom | $890–$950 | Duplex/condo units |
| 2 Bedroom | $1,130–$1,200 | Small SFR/duplex |
| 3 Bedroom | $1,510–$1,600 | Sweet spot for SFR investors |
| 4 Bedroom | $1,810–$1,900 | Premium; frequently outperforms market rent |
Verify exact zip-code-level payment standards via the Bell County Housing Authority prior to underwriting. Military BAH rates heavily influence the 40th percentile rent calculations used by HUD in this MSA.
Mid-Term Rental (MTR) Performance
Temple is a premier MTR market due to proximity to BSW, the VA Hospital, and the data-center corridor. Per Furnished Finder data, over 100 furnished rentals operate in Temple with roughly 55 available at any given time, indicating strong occupancy. A well-appointed 3BR/2BA SFR can command $2,400 to $3,000/month as a furnished MTR — a significant yield premium over traditional long-term leasing.
Tenant demographics nationally: 35% business travelers (including corridor contractors), 25% healthcare professionals (travel nurses at BSW), 20% relocating families testing the market.
BRRRR & Rehab Economics
| Rehab Level | Cost / Sq Ft | Typical Scope |
|---|---|---|
| Light Cosmetic | $10/sq ft | Paint, LVP flooring, hardware |
| Moderate Update | $30/sq ft | Kitchen/bath modernization, systems |
| Gut Renovation | $60/sq ft | Full remodel, structural work |
With new construction costing $120–$250/sq ft in Temple, significant forced-equity margins exist in repositioning 1980s and 1990s housing stock. Foreclosure activity rose 14% YoY in 2025, representing market normalization rather than systemic crisis and providing a steady flow of BRRRR-eligible inventory.
Investor transaction share: In Q3 2025, investors accounted for 34% of all U.S. single-family purchases — a five-year high per National Mortgage Professional data. 92% of those transactions came from mom-and-pop investors (1–5 properties), while mega-institutions were net sellers. The Temple/Belton market is highly liquid and actively supported by retail investment capital.
How Does Temple Compare to Austin, DFW, and San Antonio for Investors?
Temple-Belton sits in what experienced investors call the “Goldilocks Zone” — significantly cheaper than the major metros but with stronger, more diversified economic anchors than rural tertiary markets. The comparison table tells the story clearly.
| Market | Median Price | Avg Rent | Gross Yield | 1-Yr Price | Supply | Primary Driver |
|---|---|---|---|---|---|---|
| Temple / Belton | $262K / $305K | $1,550 / $1,772 | ~7.1% / ~7.0% | ↔ Flat | Balanced | Medical / Military / Tech |
| Austin (city) | $557K | $1,624* | ~3.5% | ↓ Soft | Oversupplied | Tech / Gov / Education |
| Dallas (city) | $490K | $1,576* | ~3.9% | ↑ 4% | Balanced | Corporate / Finance |
| San Antonio (city) | $265K | $1,255* | ~5.7% | ↓ 1% | Balanced | Military / Medical |
| Waco (city) | $270K | $1,338* | ~5.9% | ↓ 3% | Balanced | Education (Baylor) |
| Killeen / Harker Hts | $235K / $310K | $1,425 / $1,470 | ~7.3% / ~5.7% | ↔ Flat | Balanced | Military |
Prices: Temple/Belton/Killeen/Harker Heights from the August 19, 2026 CTXMLS export (closed-sale medians); Austin, Dallas, San Antonio, and Waco are Redfin city-level trailing-3-month medians as of August 2026. Rents: local markets from Bell County MLS closed leases through June 2026 (3BR medians); *starred metro rents are spring 2026 averages carried forward. Yields divide the shown rent by the shown price — directional, not underwriting.
What the Numbers Mean
- Austin: Still digesting severe multifamily overbuilding (submarket rent declines approached 10% in late-2025 reporting) with a $557K city median. Cap rates are deeply compressed. Investors seeking Central Texas exposure are increasingly bypassing Austin for Temple.
- Dallas: Economic powerhouse, but the city median is $490K and climbing. Yields under 4% make cash-flow deals scarce without significant value-add.
- Waco: Similar pricing to Temple but leans heavily on university-driven demand. Less diversified economic base.
- Killeen: Gross yields now rival Temple’s ($235K entry, $1,425 3BR rent) — but it is a single-driver market. Temple differentiates on demand diversification (medical + military + tech), schools, and the quality of long-term appreciation, not raw yield.
What Are the Biggest Risks for Temple TX Real Estate Investors?
No honest market report hides the headwinds. Real estate in Central Texas can be highly profitable, but 2026 comes with significant operational friction that will hurt undisciplined operators. Here is an unvarnished look.
What Is the 12-Month Outlook for Temple TX Real Estate?
The trajectory of the Temple-Belton market in late 2026 and into 2027 hinges on the interplay between mortgage rates, local infrastructure delivery, and the pace of supply absorption. Here are the three scenarios, grounded in current leading indicators.
Leading Indicators
- Building permits: Texas single-family permits forecast to rise a modest 1% in 2026, indicating builder caution and controlled supply.
- Mortgage rates: 30-yr fixed at 6.65% (PMMS, Aug 20, 2026), essentially flat vs a year ago. Buyer activity is deliberate and calculated, not panic-driven.
- Investor sentiment: CBRE’s 2026 survey: 74% of investors plan to buy more this year than last, driven by stabilizing debt costs.
- Migration: Domestic intra-state shifting continues to favor affordable I-35 corridor communities like Bell County.
Unexpected Rate Cuts + Peak Employment
Fed executes unexpected rate cuts, dropping mortgages into low 5% range. Meta construction reaches peak employment while BSW expansions add jobs simultaneously. Inventory drops below 4 months. Home values appreciate 4–6%. MTR demand surges.
Cash-Flow Optimization Environment
Mortgage rates remain range-bound at 6.3–6.9%. Temple and Belton keep absorbing inventory from the current 4.6 months of supply. Median prices flat to up 2% by year-end. Rent growth stays 0–1.5%. The market rewards disciplined operators who buy right and optimize operations.
Inflation Rebound + Supply Flood
Inflation rebounds, pushing 10-yr Treasury higher and mortgages back above 7.5%. Builder shadow inventory floods the market, pushing inventory above 7 months. Median price retracts another 3–5%. Landlords forced to offer 1–2 months free rent to maintain occupancy.

The macro environment is incredibly noisy right now. Every podcast and YouTube channel is running hot takes on rate predictions, recession calls, and “the next crash.” Ignore most of it.
What matters is the micro-economy, and Temple’s micro-economy is ironclad. You have massive federal defense spending (Fort Hood), highly recession-resistant healthcare (BSW with nearly 9,000 employees), and Big Tech infrastructure investment (Meta’s $1.2B+ campus, live since July 2026) all operating within a 30-mile radius. That kind of demand diversification is rare in secondary markets anywhere in the country.
Here is what I am actually seeing on the ground: The best opportunities right now are in the $180K–$260K range for older properties (1985–2005 builds) that need moderate rehab. Value-add is the play. You cannot compete with national builders on new construction pricing, but you can create product they do not offer — renovated, character homes in established neighborhoods with mature landscaping and no HOA. Those properties rent fast and hold tenants longer.
The risk that concerns me most is not the market — it is investor math. Too many out-of-state buyers are running their underwriting with generic insurance and tax assumptions. Texas insurance and taxes will eat your lunch if you underwrite with national averages. Use $2/sq ft for insurance and 2.2–2.5% effective tax rate, then see if the deal still works. If it does, it is probably a good deal. If it only works at $1.00/sq ft insurance, walk.
My verdict: Compare matched sale prices and rents, then underwrite the full operating budget. A 5% cap may be a useful purchase target, but neither positive cash flow nor outperformance is guaranteed. Evaluate long-term and furnished rentals separately, and include the extra costs each strategy requires.
What Changed in the Temple TX Market This Quarter?
This section tracks the most significant shifts since the spring report. It is designed for quick, independent review — bookmark it and check back after each update.
Supply Is Easing, Not Flooding
Temple’s months of supply tightened from 5.3 in the spring to about 4.6 in the August 19 CTXMLS snapshot — while 56% of active listings carry at least one price cut. Absorption is real; sellers are doing the discounting up front.
Median Drifted Into the Low $260Ks
The 58-day closing window ending August 18 printed a $261,545 Temple median — down from the $270K spring snapshot, while trailing-12 medians held flat year-over-year. Window mix explains part of the gap; the direction is still soft.
Military BAH Increase Executed
The 5.4% Basic Allowance for Housing increase officially took effect for Fort Hood personnel, injecting higher purchasing power into the rental pool and supporting Section 8 FMR valuations across Bell County.
Multifamily Pipeline Collapse Confirmed
Forward-looking multifamily deliveries across Texas have been slashed up to 50% for 2026/2027 as capital markets tightened. The imminent threat of massive apartment oversupply crushing SFR rent growth is fading rapidly.
Meta Went Live — July 22, 2026
The $1.2B+ Temple campus is now operating with roughly 100 permanent roles. The construction-phase MTR surge for building one is winding down while additional corridor projects keep contractor demand alive. Reposition MTR underwriting from “construction boom” to “corridor pipeline.”
Who Is This Market NOT Right For?
Honest filter. Temple-Belton is a strong investment market, but it is not the right fit for every investor profile:
- Rapid appreciation speculators: If your strategy depends on 10%+ annual price growth, Temple is the wrong market in 2026. This is a cash-flow environment with flat-to-modest appreciation. Buy for yield, not for flipping in 12 months.
- Passive, zero-touch investors: Texas insurance claims, tax protests, and tenant management require active engagement or a strong local property manager. This is not a set-and-forget market.
- Investors underwriting with national averages: If you run your numbers with $100/month insurance and 1.2% tax rate, your pro forma will look great and your P&L will bleed. Texas-specific costs are real and non-negotiable.
- Luxury / high-end play seekers: Temple’s sweet spot is workforce and middle-market housing. The luxury rental segment is thin and unreliable for consistent occupancy.
Frequently Asked Questions: Temple TX Real Estate Investing
Want the Full Investor Briefing for Your Target Neighborhoods?
I build custom market analysis for active investors. Tell me what you are looking for and I will send you the unvarnished data.