How Long Does It Take to Sell a House in Temple TX?
The median is 62 days. But that number hides the real story. Homes with original ask no more than 1% above close sell in 30 days. Overpriced homes sit 133. Here’s the complete breakdown.
Private seller review · MLS observed October 3, 2026
Get Your Home’s Timeline
Your street, your condition, your price posture — a realistic days-to-sold read with the pricing plan that hits it. The county median is context; this is your number.
Data: CTXMLS exports observed October 3, 2026; 722 screened Bell County Residential closing events, August 4–October 3, 2026, and 2,001 Active listings observed October 3. Price ≥ $15,000, no positive lease price, normalized street/event deduplication; conflicting prices withheld. Gaps are gross price differences, not concessions or net proceeds.
How long does it take to sell a house in Temple TX?
The median days on market in Bell County is 62 days (mean: 93). But this single number is misleading. Homes with original ask no more than 1% above close sell in a median 30 days at 100.0% of list price. Homes overpriced by 5–10% sit 94 days and sell for 97.9% of list. Homes overpriced by 20%+ sit 133 days and sell for 92.6%. The total end-to-end timeline from listing to closing is typically 3–5 months: preparation (1–2 weeks) + active market time (30–94 days depending on pricing) + contract-to-close (30–45 days). (Source: Bell County MLS, 4,723 closed sales, Oct 3, 2025–Oct 2, 2026)
- Bell County median DOM: 62 days (mean: 93 — skewed by overpriced listings)
- Original ask ≤1% above close: 30 days at 100.0% SP/LP — this is the real number
- Temple: 71 DOM | Belton: 63 | Killeen: 53 | Harker Heights: 58
- $200–$350K range: 53–63 DOM | $400K+: 75.5–92 DOM
- Contract to close: 30–45 days (financed) | 14–21 days (cash)
- 48.8% of listings had a lower final list price than original ask (median cut: $15,100)
Does overpricing a house make it take longer to sell?
This is the most important table on this page. Built from 4,723 Bell County transactions, it shows exactly what happens to your timeline when you price above market value. The recorded DOM and final-list ratios differ across retrospective original-list-gap bands; that association does not prove a causal pricing penalty.
| Original ask / eventual close | Sales | Median DOM | Sale / final list | DOM difference | Illustrative gap on $275K |
|---|---|---|---|---|---|
| Original ask ≤1% above close | 1,625 | 30 days | 100.0% | — | $0 |
| 1–3% above close | 683 | 53 days | 98.7% | +23 | −$3,575 |
| 3–5% above close | 596 | 72.5 days | 98.6% | +42.5 | −$3,850 |
| 5–10% above close | 878 | 94 days | 97.9% | +64 | −$5,775 |
| 10–20% above close | 623 | 121 days | 97.3% | +91 | −$7,425 |
| 20%+ above close | 317 | 133 days | 92.6% | +103 | −$20,350 |
Source: Bell County MLS, 4,723 closed sales, Oct 3, 2025–Oct 2, 2026. Original list price vs. close price. 12 months to Oct 2, 2026 analysis. CTXMLS Bell County Residential raw records, ClosePrice > $5,000, no deduplication. Closings October 3, 2025–October 2, 2026; exports observed September 2 and October 3, 2026, joined at May 1. DOM excludes missing/negative values and retains zero; it is recorded days on market, not listing-to-closing time. Ratios use the exported final list price unless explicitly called original list. Current Active stock is observed October 3, 2026. Per-metric valid denominators apply. Original-list gap bands compare (original list price minus closing price) / closing price, retrospectively; the first band includes homes that closed above their original ask. These groups do not prove market value, causal overpricing costs or the effect of preparation. Dollar illustrations apply the displayed sale/final-list percentage to a hypothetical $275,000 list price; they are not measured seller losses.
After 60 days on market, sophisticated buyers assume something is wrong — even if your home is fine. They either skip the listing entirely or submit a lowball offer because your price history gives them all the leverage. 48.8% of Bell County listings had a lower final list price than original ask, with a median cut of $15,100. Every cut broadcasts desperation.
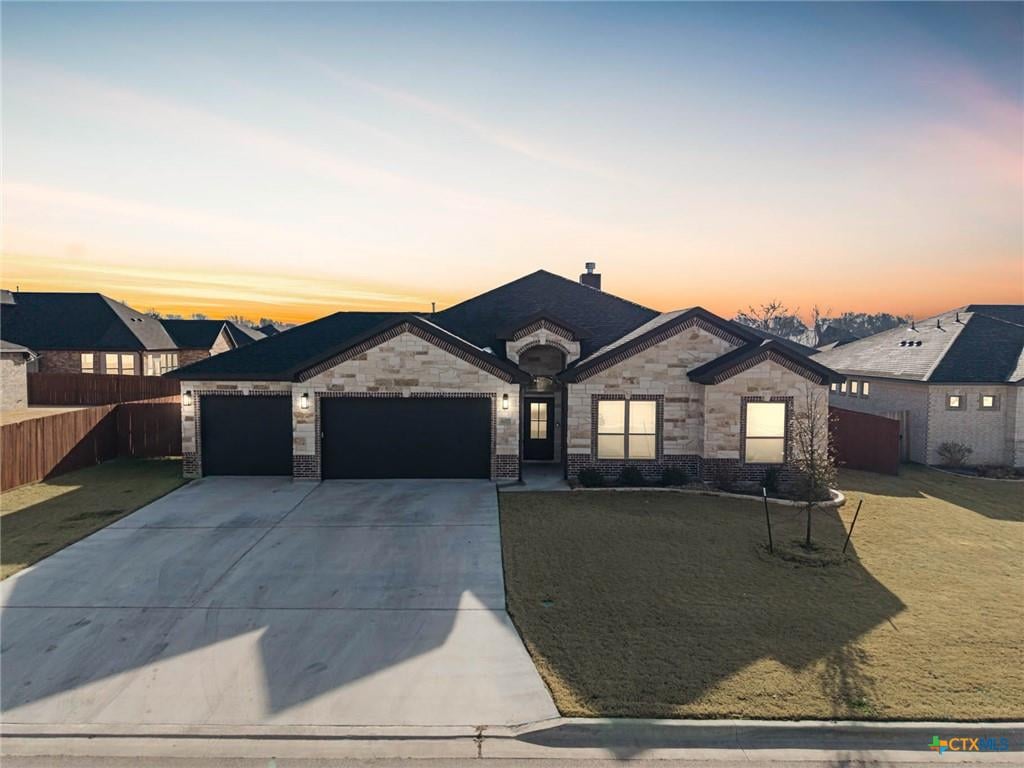
How long does it take to sell a $400K house in Temple TX?
Your price point determines your buyer pool size, which determines your timeline. The $200–$300K range has the deepest buyer pool in Bell County (BSW medical, military, first-time buyers). Above $500K, the pool shrinks and DOM stretches.
| Price Band | Closed records (12 months) | Median DOM | Sale / final list | Who’s Buying |
|---|---|---|---|---|
| <$200K | 796 | 56 | 98.4% | Investors, first-time buyers, cash buyers |
| $200–$250K | 958 | 53 | 100.0% | BSW residents, military VA, first-time |
| $250–$300K | 1,070 | 57 | 100.0% | BSW physicians, military E-7+, move-up |
| $300–$350K | 603 | 63 | 100.0% | Dual-income, established professionals |
| $350–$400K | 403 | 72 | 100.0% | Attendings, senior military, move-up |
| $400–$500K | 400 | 85 | 100.0% | Premium buyers, smaller pool |
| $500–$750K | 371 | 75.5 | 99.5% | Luxury, semi-custom, acreage |
| $750K+ | 122 | 92 | 97.4% | Ultra-premium, very small pool |
Source: Bell County MLS, 4,723 closed sales, Oct 3, 2025–Oct 2, 2026.
How long do houses sit on the market in Killeen vs. Temple vs. Belton?
Not all Bell County cities sell at the same speed. Killeen moves fastest (lower prices, deeper buyer pool). Temple has a longer median; Nolanville is close to Harker Heights. Killeen (53 days) has the lowest median among the five cities shown; Nolanville (57.5) and Harker Heights (58) follow.
| City | Closed records (12 months) | Median Price | Median DOM | SP/LP | Active Now |
|---|---|---|---|---|---|
| Harker Heights | 335 | $315,000 | 58 | 99.7% | 140 |
| Killeen | 1,655 | $235,000 | 53 | 100.0% | 717 |
| Belton | 634 | $321,987 | 63 | 99.1% | 234 |
| Temple | 1,430 | $270,000 | 71 | 100.0% | 642 |
| Nolanville | 185 | $330,000 | 57.5 | 100.0% | 89 |
Source: CTXMLS raw records, October 3, 2025–October 2, 2026 closings; September 2 and October 3 exports. Active observed October 3, 2026.
Harker Heights context: Strong military demand (close to Fort Hood’s main gate), newer housing stock, and competitive pricing by builders create a well-matched supply-demand balance. Temple’s slightly longer DOM reflects higher inventory (642 active) and a wider price range.

How long from deciding to sell to getting paid?
The total end-to-end timeline from “I want to sell” to “I have the money” is typically 3–5 months in the current Bell County market. Here’s how that breaks down.

Why is my house not selling in Temple TX?
If your home has been on the market 30+ days with low showings, the issue is almost always one of these four things — in this order of likelihood.
#1 — Price (90% of the time)
- High digital views + low showings = price is misaligned with photos
- Low digital views + low showings = price pushes you off search results entirely
- Showings but no offers = buyers see the value but the price doesn’t match the condition
- Fix: Reduce to enter a new search bracket — not $5K incremental cuts
#2 — Condition
- Deferred maintenance visible in photos (peeling paint, dated fixtures)
- Odor issues (pets, smoke) that don’t show online but kill showings
- Major system concerns (old roof, aging HVAC) flagged in agent remarks
- Fix: Address the top 3 objections or adjust price to reflect them
#3 — Photos
- Phone photos in 2026 = instant skip for scrolling buyers
- Dark, cluttered, or unflattering angles
- Missing exterior/aerial/twilight shots
- Fix: Professional photography is non-negotiable (included in Taylor’s 1.85%)
#4 — Marketing Reach
- MLS-only exposure misses out-of-state buyers (significant in Bell County)
- No targeted ads to BSW relocators, military PCS, or investor networks
- No property landing page or video
- Fix: Multi-channel distribution to qualified demographics

The honest truth about selling timelines

I’m going to tell you something most listing agents won’t: the “average DOM” number is almost meaningless. The median for Bell County is 62 days, but that includes the correctly priced home that sold in 3 weeks AND the overpriced home that sat for 5 months before the seller finally dropped the price twice and accepted less than they would have gotten on Day 1.
The real question isn’t “how long does it take to sell a house.” It’s “how long does it take to sell a correctly priced house.” And the answer is 30 days at full ask. That’s not a sales pitch — that’s 1,625 transactions.
If you’re in the $200–$350K range in Temple or Belton, you have the deepest buyer pool in Central Texas. BSW hires hundreds of medical professionals annually. Fort Hood processes thousands of PCS moves. Austin overflow continues. Those buyers need housing at YOUR price point. Price right and they’ll find you.
Above $400K, the math changes. DOM stretches to 75.5–92 days because the buyer pool shrinks. That’s not a market problem — it’s a math problem. Fewer buyers at that price means more patience required. If you can’t wait, you price more aggressively. If you can wait, you hold firm but don’t anchor to a fantasy number.
Want to know your home’s specific timeline? Call me about your address → 254-718-4249
Selling timelines in Bell County — questions answered
Median 62 days on market, but this varies dramatically by pricing accuracy. Homes with original ask no more than 1% above close: 30 DOM at 100% SP/LP. Overpriced by 5–10%: 94 DOM at 97.9%. The total timeline from listing to getting paid is 3–5 months including pre-listing prep, active market time, and the 30–45 day contract-to-close period. (Source: Bell County MLS, 4,723 closed sales, Oct 3, 2025–Oct 2, 2026)
Temple has a median 71 DOM with a 100.0% sale-to-list ratio across 1,430 sales (12 months to Oct 2, 2026). Slower than Killeen (53 DOM) and Harker Heights (58 DOM) due to higher inventory and price points.
May through August is the peak window. June historically achieves the best SP/LP ratio (100.4%) and fastest DOM. January and December are slowest. Listing in spring captures BSW hiring cycles, military PCS moves, and school-calendar family relocations — all peaking in Q2–Q3.
90% of the time it’s price. If digital views are high but showings are low, the photos attract but the price repels. If everything is low, you’re priced out of search results entirely. 48.8% of Bell County homes had a lower final list price than original ask. Each incremental cut signals desperation — make one significant adjustment based on data, not hope.
Killeen has the lowest median DOM among the five cities shown: median 53 DOM at 100.0% SP/LP. The lower median price ($235,000) creates a deep buyer pool of first-time buyers, military VA borrowers, and investors. 1,655 homes sold in the 12 months to Oct 2, 2026.
The dated records show different DOM medians. Original ask ≤1% above close: 30 DOM, 100% SP/LP. 1–3% over: 53 DOM, 98.7%. 5–10% over: 94 DOM, 97.9%. 20%+ over: 133 DOM, 92.6%. On a $275K home, the 10–20% original-list-gap group had 91 more median DOM; its sale/final-list ratio implies a $7,425 illustrative gap. The “room to negotiate” costs more than it saves.
Total timeline: 1–2 weeks prep + active market time (30–94 days) + 30–45 days contract to close (financed). Cash transactions close in 14–21 days. The contract-to-close phase includes the 5–7 day Option Period, 10–14 day appraisal, and title/closing coordination.
The $400–$500K range sells at a median 85 DOM — significantly longer than the $200–$300K range (53–57 DOM). Only 400 sales in that band vs. 2,028 in the $200–$300K range. The buyer pool thins above $400K. At $500K+, DOM stretches to 75.5–92 days. Precise pricing matters even more at higher price points.
Want to Know Your Home’s Specific Timeline?
Your home’s DOM depends on price band, neighborhood, condition, and pricing accuracy. Taylor will show you the comps, the competition, and a realistic timeline — before you commit to listing.