Temple VS Belton
The data-backed scorecard nobody else will publish.
Temple’s median sold price is $274,315 vs. Belton’s $320,000 (trailing 12-month MLS closed sales, July 2026 pull). Belton’s 2-year median was $330,000—the most recent quarter dropped to roughly $310,000, about −10% year-over-year. The gap is narrowing. Belton ISD outscores Temple ISD on state ratings. Temple dominates on employer access, inventory, and day-to-day costs. Belton wins on crime stats and lake lifestyle. And there’s a geographic overlap zone where you can buy a Temple-priced home and send your kids to Belton ISD schools. This page breaks it down category by category—with a verdict for each—so you can make a decision based on data, not marketing.
All data reflects 2025–2026 rates and market conditions. Sources: BellCAD, TEA, Realtor.com, Redfin, NeighborhoodScout, ERCOT. Verify current figures before underwriting.
Temple is the better value play—median sold price $274,315 vs. Belton’s $320,000 (trailing 12-month MLS, July 2026; Belton’s recent quarter ≈ $310,000). Both cities are depreciating. Belton is the better lifestyle play—Belton ISD rates B (80) vs. Temple ISD’s C (77), violent crime is roughly one-third of Temple’s, and lake access is unmatched. The strategic move: buy in Temple’s western overlap zone (Sage Meadows, Bella Terra) to get Temple prices with Belton ISD schools—though you’ll pay the highest combined tax rate in the area (~2.40%).
- Temple median sold: $274,315 | Belton: $320,000 (trailing 12 mo, July 2026 MLS; Belton recent Q ≈ $310,000) — gap narrowing
- Temple tax rate: ~2.39% | Belton tax rate: ~2.01% — Temple is $1,025/yr more on $300K
- School ratings: Belton ISD B (80) vs. Temple ISD C (77) — but Temple passed $120M bond; Belton rejected 3 of 4
- BSW commute: Temple <10 min | Belton ~15 min
- YoY price change: Temple −2.9% to −3.3% | Belton −10% (MLS sold data) — both depreciating
- Days on market (active listings): Temple 72 | Belton 65 (July 2026 MLS)
- Crime (violent per 1K): Temple 3.19 | Belton ~0.93 — Temple still below national median (4.0)
The Current MLS Snapshot — Temple vs. Belton Today
Here are the freshest Central Texas MLS closed-sale medians, pulled July 4, 2026 (trailing 12 months). Read these as the current headline numbers; the round-by-round tables below carry the deeper, longer-window history. Temple is the value play — lower price, lower price per square foot, more inventory, and the shortest drive to the Baylor Scott & White hospital. Belton is the premium play — you pay roughly $47K more almost entirely for the higher-rated school district (Belton ISD) and Lake Belton.
| Metric (Updated July 2026) | Temple — value play | Belton — premium play |
|---|---|---|
| Median Sold Price | $274,315 | $320,000 |
| Median Price / Sq Ft | $158 | $174 |
| Median Days on Market | 72 days | 65 days |
| Active Listings | 815 | 320 |
| School District (TEA) | Temple ISD · C | Belton ISD · B |
| Belton Premium (median) | ~$46K more in Belton — paid for schools + the lake | |
Source: Central Texas MLS closed sales, trailing 12 months, verified June 2026. Two pages do the heavy lifting from here: if your move is driven by the hospital, start with homes for sale near Baylor Scott & White (ranked by commute). If you want the neighborhood-level read on each city, see the ranked best neighborhoods in Temple and best neighborhoods in Belton. Medians, inventory, and school ratings change — verify current figures and the exact zoned schools for a specific address before deciding.
What Do Homes Actually Cost in Temple vs. Belton?
Temple’s median sold price is $274,315 (trailing 12 months, July 2026 MLS pull). Belton’s is $320,000; its 2-year MLS median was $330,000, but the most recent quarter has dropped to $310,000—roughly −10% year-over-year. The price gap between the two cities is narrowing as Belton corrects faster than Temple. Both markets are firmly in buyer territory. Belton’s DOM has actually improved (median 43 days in the latest quarter vs. 84 days a year ago), suggesting motivated sellers are pricing aggressively to move inventory.
| Market Metric | Temple | Belton (MLS Data) |
|---|---|---|
| Median Sold Price (Trailing 12 Mo — July 2026) | $274,315 | $320,000 |
| Median Sold (Recent Quarter) | ~$280,000* | $310,000 |
| Median Price / Sq Ft (sold) | $158 | $174 |
| Median Days on Market (sold) | 72 days | 65 days |
| Active Listings (July 2026) | 815 | 320 |
| YoY Price Change | −2.9% to −3.3% | −10.6% |
| Closed Sales (Trailing 12 Mo) | 1,481 | 629 |
*Temple’s recent-quarter median estimated from Realtor.com/Redfin aggregator trends. Belton data sourced directly from MLS closed sales (730-day trend pull, March 2026; headline medians re-verified against the July 4, 2026 MLS pull). National aggregators (Realtor.com, Redfin) showed conflicting Belton YoY data (−0.44% to +12.5%); the actual MLS sold data shows a clear −10% correction.
By Zip Code
| Zip | Area | Median | $/SqFt | Avg DOM |
|---|---|---|---|---|
| 76501 | East/Historic Temple | $241,990 | $146 | 100 days |
| 76502 | South/West Temple | $315,000 | $171 | 92 days |
| 76504 | North/Central Temple | $218,720 | $146 | 89 days |
| 76513 | Belton Citywide | $330,000 | $175 | 63 days |
Zip codes matter here: 76501 and 76504 carry Temple’s lowest entry prices in the low $200Ks, while 76502—Temple’s premium new-construction corridor—runs a $315K median and closes most of the gap with Belton.
Who Pays More in Property Taxes—Temple or Belton?
Belton’s total combined tax rate is ~2.01%. Temple’s is ~2.39%. That 0.38% gap translates to roughly $1,025 more per year on a $300,000 home if you buy in Temple. But the story is more complicated than the headline rate.
| Taxing Entity | Temple Rate | Belton Rate |
|---|---|---|
| City Tax Rate | 0.6999% | 0.5225% |
| Bell County | 0.3128% | 0.3128% |
| School District (ISD) | 1.1372% (TISD) | 1.1494% (BISD) |
| Temple College | 0.2017% | N/A |
| Road District + Water | 0.0221% | 0.0221% |
| Total Combined | ~2.39% | ~2.01% |
Temple’s higher rate comes from two extra levies Belton doesn’t pay: Temple College (0.20%) and a higher city rate. However, Temple offers a 20% local homestead exemption (minimum $5,000) that Belton does not. For a $300K owner-occupied home, Temple’s local exemption saves roughly $420/year, narrowing the gap.
New subdivisions in Belton’s ETJ are frequently encumbered by Municipal Utility Districts. Bell County MUD #1 adds 0.78% and MUD #2 adds 0.95% on top of standard rates. River Farm MUD adds a full 1.0%. That can push your total rate above 3.0%—higher than either city’s standard rate. Always check the BellCAD rate table before underwriting a new build.
Temple ISD vs. Belton ISD—Which Schools Are Actually Better?
Belton ISD scores a B (80) from TEA. Temple ISD scores a C (77). On raw metrics, Belton leads. But the trend lines tell a different story—and the November 2025 bond elections may reshape the next five years entirely. For a deeper dive, see the full Bell County school comparison.
| Education Metric | Temple ISD | Belton ISD |
|---|---|---|
| TEA Overall Rating (2025) | C (77) | B (80) |
| TEA Student Achievement | 75 | 80 |
| TEA School Progress | 78 | 76 |
| TEA Closing the Gaps | 74 | 81 |
| Niche.com Grade | B | A− |
| Graduation Rate | 96.9% | 88.1%–90.0% |
| Enrollment | 8,680 | 13,808 |
| Number of Schools | 15 | 19 |
Temple ISD’s graduation rate (96.9%) is a standout—a 13-year high driven by aggressive truancy tracking. Temple High grew its TEA rating by 10 points to 79. Fred Edwards Academy, Temple’s alternative model, holds a near-perfect 99–100% graduation rate.
Temple ISD: Voters passed both bond propositions. $120M for new classrooms (zero portables), plus funding for 10 additional school police officers covering every elementary campus. Belton ISD: Voters rejected 3 of 4 bond propositions—denying modernization, HVAC, stadium, and swim center funding. Only Prop C ($6M for tech devices) passed. This creates a potential crowding and deferred maintenance risk as Belton ISD grows 3–4% annually toward 14,000+ students.
Belton ISD’s specialized Belton New Tech @ Waskow (TEA rating: A, 91) is a legitimate draw for STEM-focused families. Temple ISD counters with IB programming and Career & Technology pathways.
How Far Is Temple vs. Belton from BSW, Fort Hood, and I-35?
Downtown Temple to BSW Main Campus: under 10 minutes. Downtown Belton to BSW: approximately 15 minutes. For surgical residents pulling 80-hour weeks or ER physicians on rotating shifts, that 5-minute difference compounds into hundreds of hours over a 3–7 year training period. If you’re relocating for Baylor Scott & White, Temple is the proximity play — see the homes for sale near Baylor Scott & White ranked by drive time to the hospital.
| Destination | From Temple | From Belton |
|---|---|---|
| BSW Main Campus | <10 min | ~15 min |
| Fort Hood Main Gate | 35 min (20.4 mi) | 35 min (21.1 mi) |
| Downtown Austin | ~60 min | ~55 min |
| Downtown Waco | ~35 min | ~40 min |
| Nearest I-35 On-Ramp | 0–10 min | 0–10 min |
Fort Hood is equidistant from both cities (~35 minutes). The I-14/US-190 corridor handles east-west military commute traffic efficiently. For Fort Hood families using BAH, neither city has a commute advantage—the decision shifts to housing budget and school preference.
Employment Engines
Temple is the jobs city. BSW alone employs 8,884 people—more than Belton’s entire top-5 employer list combined (5,204). Temple’s economy is anchored by healthcare, logistics (McLane, H-E-B distribution, BNSF Railway), manufacturing (Wilsonart), and incoming investment: a $110M SeAH Superalloy Technologies plant and a $700M Rowan hyperscale data center—the first ground-broken phase of Temple’s $2.1B data center pipeline. Belton’s economy runs on government, education (Belton ISD, UMHB), and residential development.
Is Temple or Belton Safer?
Belton’s violent crime rate (~0.93 per 1,000) is roughly one-third of Temple’s (3.19 per 1,000). On raw numbers, Belton wins decisively. But context matters. For the full breakdown, see Is Temple TX Safe?
| Crime Metric | Temple | Belton | National Median |
|---|---|---|---|
| Violent Crime (per 1,000) | 3.19 | ~0.93 | 4.0 |
| Property Crime (per 1,000) | 23.77 | ~20.4 | 18.0 |
In 2024, Temple PD switched from UCR to NIBRS crime reporting. UCR tracked only the most serious offense per incident; NIBRS tracks all offenses across 20+ categories. Crime appears to spike statistically, but the department confirms this reflects reporting accuracy, not deterioration. Temple’s violent crime rate (3.19) still sits below the national median (4.0) and the Texas average (3.89). NeighborhoodScout identifies the Historic District, Meador Grove, and West Temple as Temple’s safest enclaves.
Belton reported a 23% reduction in overall crime volume entering 2025, attributed to increased police presence and expanded budget. For families prioritizing statistical safety above all else, Belton is the clear choice.
What Does It Cost to Live in Temple vs. Belton Day-to-Day?
Median rent in Temple is $1,525/month. In Belton, it’s $1,747/month. That $222/month “Belton ISD premium” adds $2,664/year to a renter’s budget. Most other holding costs are identical. For a comprehensive breakdown, see the Temple cost of living analysis.
| Living Cost | Temple | Belton |
|---|---|---|
| Median Rent (Citywide) | $1,525/mo | $1,747/mo |
| Childcare (Avg Monthly) | $2,209 | $2,280 |
| Electricity (Avg $/kWh) | ~13.75¢ | ~13.75¢ |
| Total Utilities (2,000 sqft) | $377–$460 | $377–$460 |
| Median Household Income | $74,923 | Not reported* |
*Belton’s elevated housing prices imply higher demographic income, but exact municipal data is unavailable.
Both cities are approximately 12% below the national cost-of-living average and 3–5% below the Texas state average. Electricity is deregulated (ERCOT)—you choose your provider via Power to Choose. For first-time buyers on tight budgets, Temple’s lower rent and acquisition costs create significantly more breathing room.
Temple or Belton—Which City Has a Better Lifestyle?
These cities serve fundamentally different lifestyle preferences. Temple is the commercial hub. Belton is the outdoor escape. Neither has a nightlife scene—local forums routinely describe the area as quiet and family-oriented. If that’s a dealbreaker, look elsewhere.
| Category | Temple | Belton |
|---|---|---|
| Lakes & Outdoors | Limited | Belton Lake + Stillhouse Hollow |
| Dining & Retail | West Adams corridor (dense retail) | Old Town Belton (boutique) |
| Healthcare Access | BSW Main + VA Medical Center | BSW Hillcrest (smaller campus) |
| Nightlife | Minimal | Minimal |
| Population | ~97,986 | ~23,054 |
| Character | Urban-suburban, diverse | Small-town, family-centric |
Belton’s proximity to Belton Lake and Stillhouse Hollow is a genuine differentiator for boating, fishing, and trail families. Neighborhoods like The Groves at Lakewood Ranch and Three Creeks integrate directly with lake trails. For the full picture of day-to-day life on the Belton side — schools, the lake, commutes, and the courthouse-square town feel — see the Living in Belton, TX guide. Temple’s West Adams corridor is where most of Bell County goes to shop, eat, and run errands—regardless of which city they live in.
What Kind of Houses Will You Find in Temple vs. Belton?
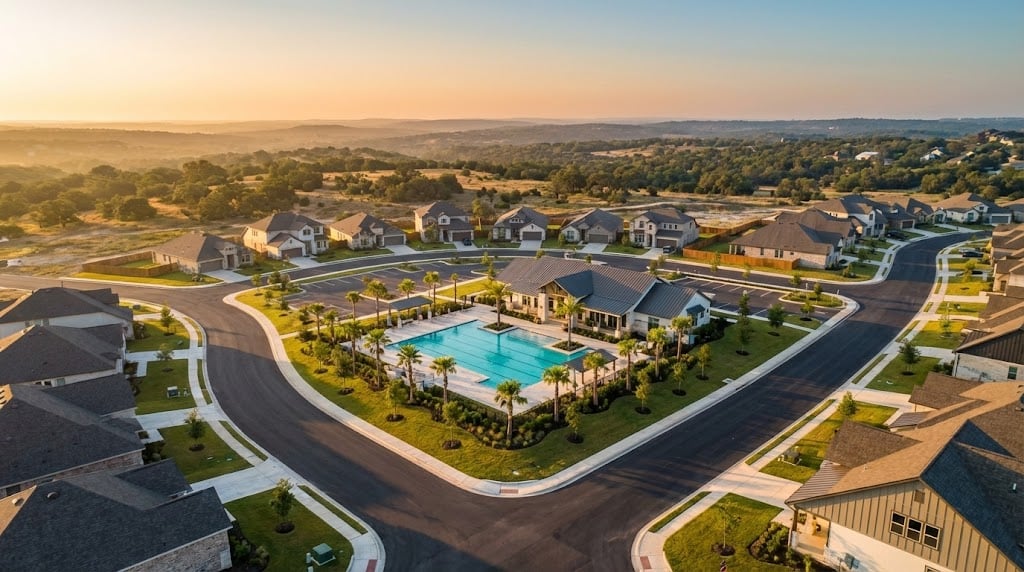
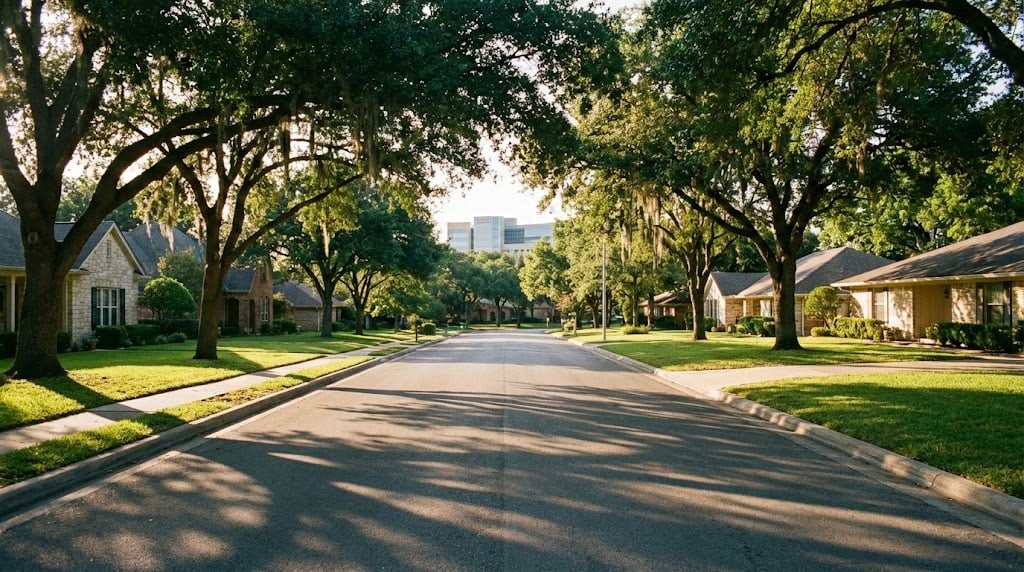
Temple has diversity. Belton has uniformity. Temple’s housing stock spans a century—from historic pier-and-beam homes in the downtown district to mass-produced new construction along the West Adams corridor. Belton is almost entirely post-2000 master-planned communities on slab foundations, driven by BISD’s magnetic pull on developers.
Belton ISD’s footprint contains 53 actively building subdivisions with ~2,250 available lots and 9 future subdivisions planning 5,000+ lots. Temple’s new construction scene is concentrated in the 76502 zip code corridor.
Bell County sits on expansive clay soil that swells when wet and contracts in drought. Slab-on-grade foundations (dominant in both cities) are vulnerable to differential settling. If you don’t run soaker hoses around your slab during dry Texas summers, you risk cracking. Budget for a foundation inspection on any resale purchase—especially in Temple’s older neighborhoods. Pier-and-beam foundations (common in Temple’s Historic District) handle the soil better but require crawlspace maintenance.
The Overlap Zone: Temple Address, Belton ISD Schools
This is the most underreported real estate opportunity in Bell County. Due to historical zoning boundaries, the western and southwestern portions of Temple city limits fall within Belton ISD attendance zones. You buy a home at Temple prices, send your kids to Belton ISD schools, and use Temple municipal services. The two named examples are Sage Meadows and Bella Terra—City of Temple addresses served by Belton ISD. Boundaries verified July 2026; attendance zones can be redrawn, so parcel-check the specific address with Belton ISD before you write an offer.
BISD Schools Serving Temple Addresses
Charter Oak Elementary, High Point Elementary, Lakewood Elementary, Pirtle Elementary, Alice J. Tarver Elementary, and Burrell Elementary all serve families living within Temple city limits.
The overlap zone combines Temple city taxes with Belton ISD taxes, producing a combined rate of approximately 2.40%—higher than either city’s standard rate. On a $300K home, that’s roughly $7,200/year in total property taxes. You save on acquisition (Temple’s lower price floor) but pay a premium in annual taxes for the BISD school access.
For families relocating from high-cost markets (Austin, DFW, California), the math often still works: a $300K home in the overlap zone with B-rated schools and a $7,200 tax bill is dramatically cheaper than the $450K+ you’d pay for equivalent school ratings in the Austin suburbs. The overlap zone is especially popular among BSW professionals who want short commutes and strong schools without Belton’s price premium.
My Honest Read on Temple vs. Belton

Buying as an investment instead of a home? That analysis runs on different math and gets its own page — start at the investing hub.
If you’re a BSW resident pulling 80-hour weeks, buy Temple. That extra 5 minutes to Belton adds up. I’ve helped PGY-1s with physician mortgage loans land in the overlap zone—Temple prices, Belton ISD, 8 minutes to the OR.
If schools are your only priority and budget isn’t tight, buy Belton. The B rating is real. Belton New Tech is genuinely impressive. But keep your eyes on those rejected bonds. BISD is growing 3–4% annually and just lost funding for modernization. Temple ISD is the momentum play.
One thing I tell every client: don’t buy a new build in a MUD district without checking the tax rate table first. I’ve seen buyers close on a $320K home in a Belton-area MUD, then get hit with a 3.1% effective tax rate that killed their monthly payment assumptions. BellCAD publishes these rates. Your lender won’t check for you.
Final Scorecard: Temple vs. Belton
The bottom line: Temple wins on economics—cheaper homes, more selection, more jobs, lower daily costs. Belton wins on quality-of-life metrics—better schools (for now), lower crime, prettier setting. But the market is shifting: Belton prices are correcting faster (−10% YoY vs. Temple’s −3%), narrowing the price gap and weakening Belton’s premium. Neither is universally “better.” The right city depends on whether you’re optimizing for your wallet or your weekend. And if you want both? The overlap zone exists for exactly that reason.
Who Should Buy in Temple? Who Should Buy in Belton?
Choose Temple If You Are…
| Buyer Profile | Why Temple |
|---|---|
| BSW resident/attending (shift work) | <10 min to main campus; every minute counts at 80 hrs/week |
| First-time buyer on a budget | $215K–$290K entry points; more inventory = more leverage |
| Budget-conscious family | Lower rent, lower acquisition, overlap zone for BISD schools |
Choose Belton If You Are…
| Buyer Profile | Why Belton |
|---|---|
| Family prioritizing schools above all | BISD B (80), Niche A−, Belton New Tech A (91) |
| Outdoor/lake lifestyle buyer | Belton Lake + Stillhouse Hollow direct access |
| Buyer seeking small-town feel | 23K population, Old Town Belton walkable district |
| Over-65 homeowner seeking quiet | Lowest crime rates in Bell County, tax freeze available |
Temple vs. Belton—Common Questions
Belton ISD earns a B (80) from TEA versus Temple ISD’s C (77), and Belton’s violent crime rate is roughly one-third of Temple’s. However, Temple passed $120M in school bonds in November 2025 while Belton voters rejected 3 of 4 bond propositions, creating a potential facility crowding risk in BISD. Families prioritizing school ratings today choose Belton; families betting on trajectory and lower home prices choose Temple—especially in the overlap zone where Temple addresses feed into Belton ISD schools.
Temple is cheaper, though the gap is narrowing. Temple’s median sold price is $274,315 versus Belton’s $320,000 (trailing 12-month MLS, July 2026 pull). Belton’s most recent quarter dropped to roughly $310,000—about −10% year-over-year. Temple’s median price per square foot is $158 compared to Belton’s $174. However, Temple’s combined property tax rate (~2.39%) is higher than Belton’s (~2.01%). On a $300,000 home, Temple taxes run approximately $7,050/year versus Belton’s $6,025/year.
Yes. Due to historical zoning boundaries, the western and southwestern portions of Temple city limits fall within Belton ISD attendance zones. Schools like Charter Oak, High Point, Lakewood, Pirtle, Alice J. Tarver, and Burrell Elementary serve Temple addresses. The trade-off is a combined tax rate of approximately 2.40%—the highest in the area—because you pay Temple city taxes plus Belton ISD taxes. But you get Temple’s lower home prices with Belton’s B-rated school district.
Temple and Belton are approximately 9 miles apart via I-35, with a drive time of 12–15 minutes in normal traffic. The cities share the same Bell County infrastructure and are connected by both I-35 and Highway 317. Many residents live in one city and work or shop in the other. The West Adams corridor in Temple is the primary commercial connector.
Belton has lower crime rates across the board—violent crime near 0.93 per 1,000 residents versus Temple’s 3.19. However, Temple’s numbers appear inflated due to a 2024 switch from UCR to NIBRS crime reporting, which counts all offenses per incident rather than just the most serious one. Temple’s violent crime rate (3.19) still sits below both the national median (4.0) and Texas average (3.89). Belton reported a 23% crime reduction entering 2025.
Temple’s total combined rate is approximately 2.39% (City 0.70% + County 0.31% + Temple ISD 1.14% + Temple College 0.20% + minor districts). Belton’s total rate is approximately 2.01% (City 0.52% + County 0.31% + Belton ISD 1.15% + minor districts). Temple offers a 20% local homestead exemption that Belton does not, partially offsetting the higher rate for owner-occupants. New subdivisions with MUD districts can push Belton-area rates above 3.0%.
Temple is significantly closer. Downtown Temple to BSW Main Campus is under 10 minutes. Downtown Belton to BSW Main Campus is approximately 15 minutes. For BSW medical professionals working variable shifts—especially surgical residents and ER staff—Temple’s proximity advantage compounds over thousands of commute trips during a 3–7 year residency or fellowship.
Related Decision Pages
Free · No pressure
Want your exact number before you tour anything?
Send me the address (or your must-haves) and I’ll pull the real assessed value, the exact taxing entities, and your true monthly payment. You’ll also get the Temple-vs-Belton 2026 Cost Sheet (PDF) the moment you submit.
Download the Cost Sheet (PDF)
I’ll text or email your address-specific Temple-vs-Belton breakdown within one business day. Prefer to talk now? Call or text 254-718-4249.
Still Not Sure?
Let’s Run Your Numbers.
Temple vs. Belton depends on your budget, your job, your timeline, and your strategy. I’ll run the math for your specific situation—investor, BSW relocator, or military family.
Or text directly: 254-718-4249 | dealswithdasch@gmail.com