


Austin vs Temple TX: Where Is the Better Real Estate ROI in 2026?
A data-driven comparison of two Texas markets — one cooling from a tech-fueled boom, one quietly compounding investor returns. Here are the numbers that matter.
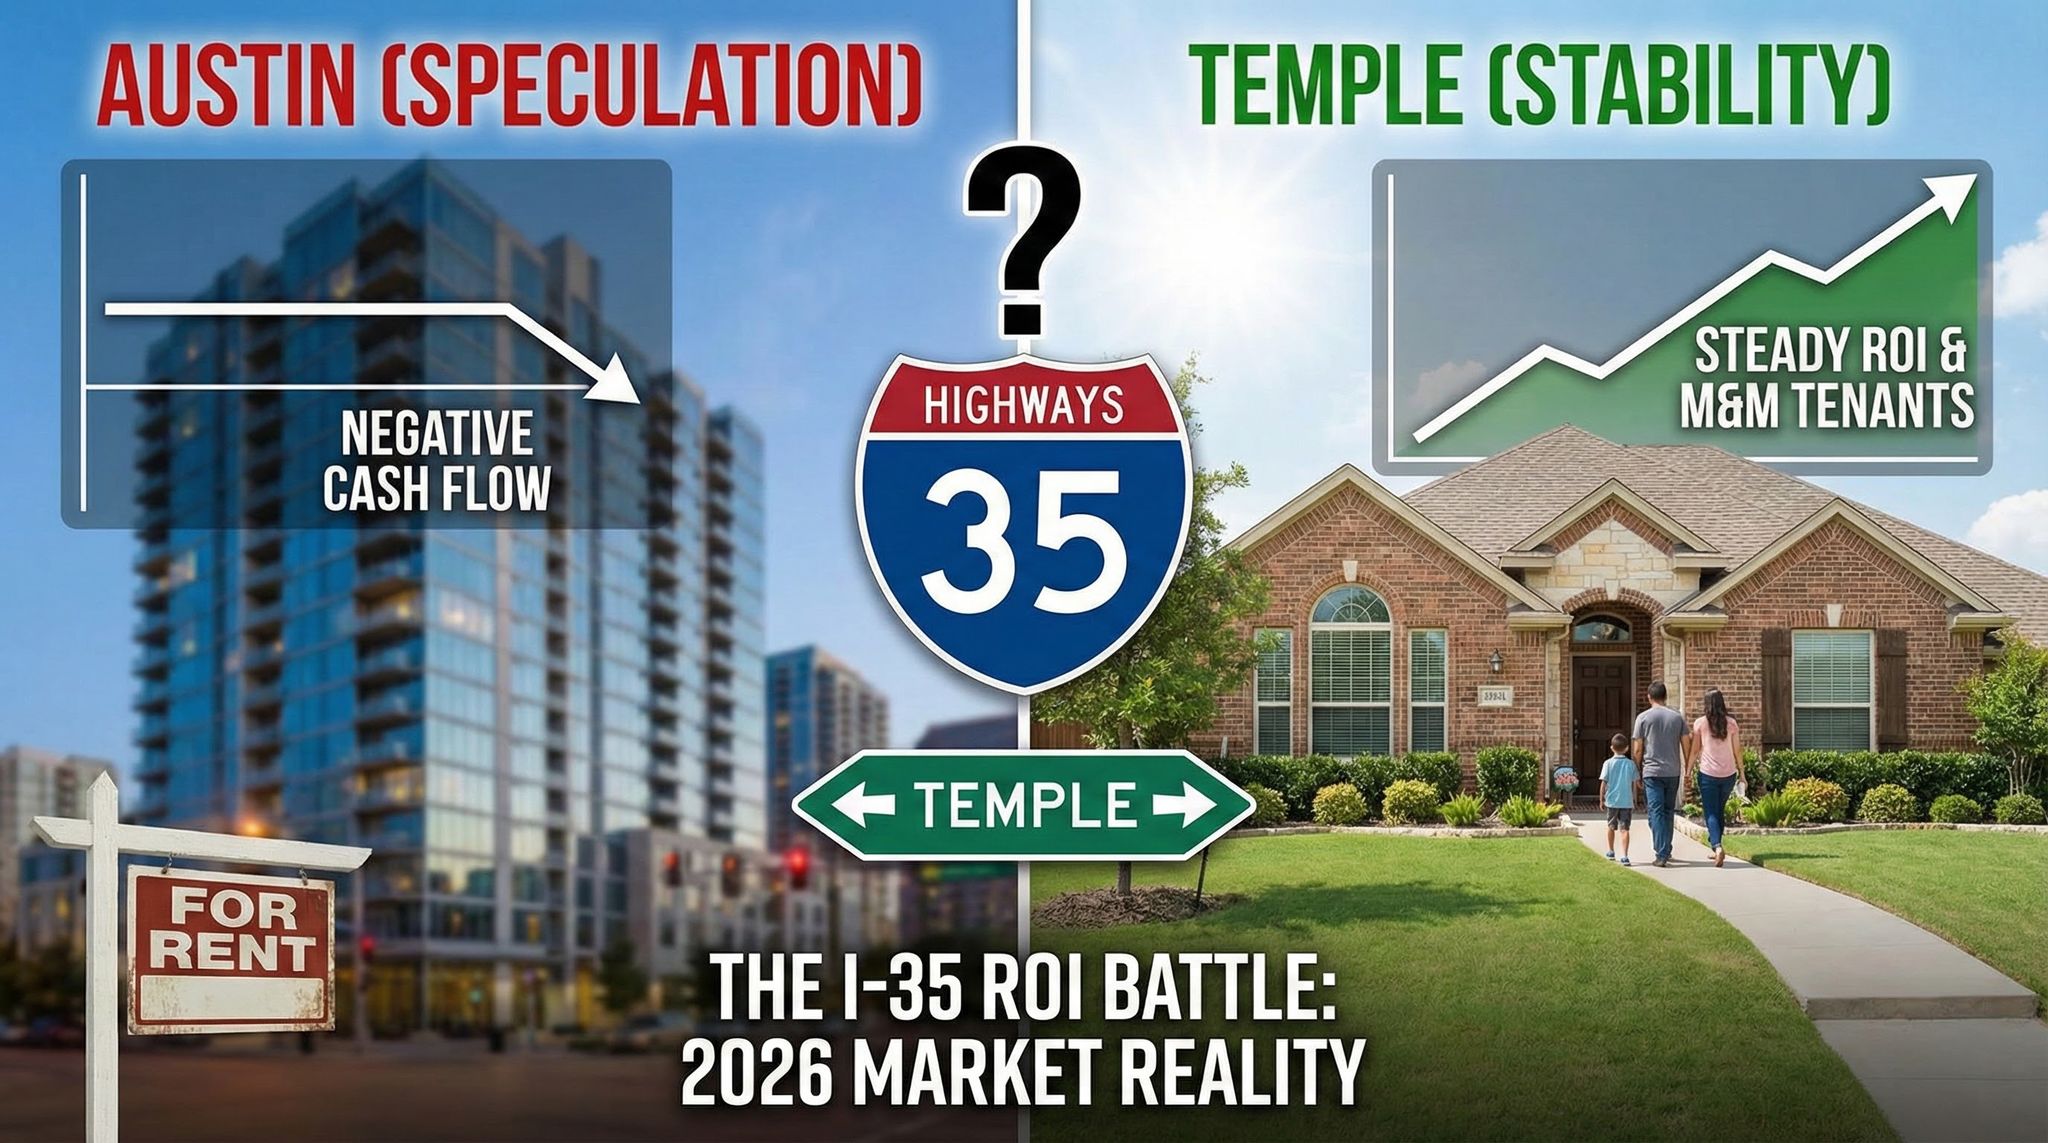
How Do Austin and Temple TX Compare for Real Estate Investors in 2026?
As of March 2026, Austin's median home price sits at approximately $415,000 — down 24.5% from its May 2022 peak of $550,000 — while Temple offers investor-grade entry points around $240,000, positioning it 42% below Austin's price floor. That gap is where the ROI conversation starts, but it is far from where it ends.
Austin spent 2022–2024 as the poster child of pandemic-era overheating. A flood of 33,000 new apartment units delivered in 2024 alone pushed vacancy rates to 10.2% — top five nationally — and crushed rents 17–20% from peak. Tech layoffs continued into 2026, with corporate relocations dropping from 64 companies in 2022 to just 11 through mid-2024. The market likely won't find equilibrium until mid-2027.
Temple, 70 miles north on I-35, operates on a different engine entirely. The Killeen-Temple metro is growing at 3.1% annually and approaching 100,000 residents. Three massive employer anchors — Baylor Scott & White Health (Central Texas's largest employer), Fort Cavazos (the largest active-duty armored post in the U.S.), and a new wave of data center investment totaling $1.5 billion (Meta's $800M campus plus Rowan's $700M facility) — provide the kind of demand diversification that lets investors sleep at night.
This is not a "which city is better" argument. It is a math problem. And the math tells different stories depending on whether you prioritize cash flow, appreciation, or total return.
What Does $300K Buy You in Austin vs Temple?
A $300,000 budget in Austin buys a 1,100–1,300 sq ft condo or a dated 2-bedroom home in a fringe suburb like Manor or Del Valle — often built in the 1990s, likely with an HOA of $200–$400/month, and competing with 4.8 months of inventory sitting on the market. In Temple, $240,000 buys a 1,600–1,800 sq ft, 3-bedroom single-family home built between 2018 and 2022, in a master-planned community with low or no HOA — and you still have $60K left over for your next deal.
Austin — $300K Property
Temple — $240K Property
The HOA difference alone is devastating for Austin investors. At $300/month, that is $3,600/year in non-recoverable expense that directly erodes cash flow. In Temple, most single-family communities either have no HOA or charge $25–$50/month for basic common-area maintenance. That $3,000+ annual savings goes straight to your bottom line.
Which Market Has Better Cash Flow — Austin or Temple?
Neither Austin nor Temple produces positive cash flow on a traditional long-term rental at current interest rates — and any analysis that claims otherwise is lying to you. The difference is in how much you lose. Temple runs approximately -$343/month negative, while Austin bleeds -$1,814/month. Here is the full underwriting on a representative deal in each market, assuming 25% down and a 6.75% interest rate on a 30-year fixed investment loan.
The numbers speak for themselves. Both markets produce negative cash flow on a traditional long-term rental at current interest rates — but the magnitude of the loss is wildly different. Austin bleeds -$1,814/month while Temple loses -$343/month. That $1,471/month gap is $17,652/year. Temple's lower capital requirement ($60K down vs $104K) also means you have $44K left to absorb losses, invest in a second property, or convert to a mid-term rental strategy that can flip the deal positive.
How Do Property Taxes Compare Between Austin and Temple?
Austin and Temple have effectively the same total property tax rate — approximately 2.07% across all taxing entities. The difference is not the rate, it is the basis. A $240K Temple investment property generates a $4,968/year tax bill, while a $415K Austin property generates $8,591/year. That is a $3,623/year difference ($302/month) driven entirely by lower home prices, not a lower tax rate. Austin's rate breaks down across the City of Austin ($0.5240 per $100), Travis County ($0.3758), Austin ISD ($0.9252 combined M&O and I&S), Austin Community College, and Central Health. Temple's combined rate includes the City of Temple ($0.6999 per $100), Bell County ($0.3125), Temple ISD, and related entities.
| Tax Metric | Austin | Temple |
|---|---|---|
| Effective Tax Rate | ~2.07% | ~2.07% |
| Tax on Investor Property | $8,591/yr ($415K) | $4,968/yr ($240K) |
| Annual Tax Savings | — | $3,623/yr ($302/mo) |
| City Rate (per $100) | $0.5240 | $0.6999 |
| County Rate (per $100) | $0.3758 | $0.3125 |
| Homestead Exemption | Available (primary only) | Available (primary only) |
The real story is entirely about the basis. The tax rates are the same. But because Temple homes cost 42% less than Austin homes, the absolute tax bill is dramatically lower. An investor paying $8,591/year on an Austin rental versus $4,968/year on a Temple rental has a $3,623 annual gap — that is $302/month of pure expense savings that flows directly to the bottom line.
What's Driving Tenant Demand in Each Market?
Austin's tenant base is heavily concentrated in the technology sector, which shed 1.6% of big-tech jobs and 4.9% of startup jobs in 2024 alone. Temple's demand is anchored by three recession-resistant pillars: healthcare, military, and logistics — industries that hire regardless of stock market performance.
Austin's Demand Drivers
Austin's economy revolves around technology, with employers like Apple, Tesla, Google, Meta, and Samsung maintaining major campuses. However, the dependency cuts both ways. Corporate relocations to Austin dropped from 64 in 2022 to 11 through mid-2024. Oracle relocated its headquarters from Austin to Nashville in 2024. AI-driven restructuring continues to eliminate positions — 55% of hiring managers surveyed expect layoffs in 2026, with 44% citing AI as a primary driver. The result: Austin's apartment vacancy rate hit 10.2% in 2025, with rents down 17–20% from peak.
Temple's Demand Pillars
Healthcare: Baylor Scott & White Health operates its flagship medical campus in Temple with over 500 active job postings. A new 45-bed inpatient rehabilitation hospital opened January 2026 through a joint venture with Select Medical. BSW is Central Texas's largest employer, generating a constant flow of nurses, technicians, physicians, and administrative staff who need housing within a 15-minute commute.
Military: Fort Cavazos (formerly Fort Hood) stations approximately 45,000 active-duty soldiers and supports over 100,000 total military-connected individuals. The 2026 BAH rate for an E-5 with dependents is $1,695/month, and an E-7 with dependents receives $2,070/month. These rates align perfectly with Temple's rental market, making Temple properties a natural fit for military families receiving guaranteed government housing allowances.
Data Centers & Logistics: Meta's $800 million hyperscale data center campus is under active construction with completion expected through 2026. Rowan Digital Infrastructure received unanimous City Council approval for a $700 million data center campus, with groundbreaking in late 2025 and first-phase completion in fall 2026. Combined with FedEx distribution operations, these investments represent $1.5+ billion in new economic infrastructure that generates both construction jobs now and permanent operations jobs for decades.
"Austin's economy is a thoroughbred — explosive on the straightaway, vulnerable to stumbles. Temple's economy is a Clydesdale — not flashy, but it pulls the weight every single day."
Which Market Has Lower Risk for Investors?
Temple carries lower investment risk across every measurable dimension except one: liquidity. Austin's apartment vacancy rate of 10.2% dwarfs Temple's estimated 5–7% for well-located single-family homes. Austin's oversupply problem — 33,000 apartment units delivered in 2024, with another 17,500 in 2025 — won't stabilize until mid-2026 at the earliest, and rents may not meaningfully recover until 2027.
| Risk Factor | Austin | Temple |
|---|---|---|
| Vacancy Rate | 10.2% (top 5 nationally) | 5–7% (SFH estimate) |
| Rent Trend | Down 17–20% from peak | Down 2.8% YoY (stable) |
| Employer Concentration | Tech-heavy | Medical / Military / Logistics |
| New Supply Pipeline | 4,600 units in 2026 | Limited new inventory |
| Price from Peak | -24.5% | -2.9% |
| Days on Market | 89 days | 45–75 days (SFH) |
| Government-Backed Income | No | Yes (BAH / VA) |
The employer diversification story deserves emphasis. When a single tech company lays off 500 people in Austin, those tenants may need to relocate or downsize immediately. In Temple, if one sector softens, the other two continue generating demand. A BSW nurse, a Fort Cavazos NCO, and a Meta facilities technician all need the same thing: a 3-bedroom house near work and schools. That diversity is an investor's insurance policy.
Austin's one advantage: market depth. It is far easier to buy and sell properties in a metro of 2.3 million than in a city of 96,000. If you need to exit a Temple investment quickly, you may have fewer buyers competing. For buy-and-hold investors on a 5–10 year timeline, this is irrelevant. For flippers, it matters.
What About Appreciation — Does Austin Still Win?
Over the last decade, Austin appreciation has outpaced Temple by a significant margin. But "appreciation" without context is a vanity metric. When you factor in cash flow, tax burden, and total capital deployed, the picture shifts.
Austin's median home has declined 24.5% from peak — from $550,000 in May 2022 to $415,000 as of February 2026. An investor who bought at the 2022 peak has lost over $135,000 in equity. Recovery to prior peak levels is projected to take until 2028–2029 based on 25-year appreciation trend data. Temple's median, by contrast, declined just 2.9% year-over-year, reflecting mild normalization rather than correction.
Here is the total return math over a 5-year hold, assuming conservative appreciation scenarios:
Even though both markets produce negative monthly cash flow, Temple's total return over 5 years is +$32,045 (47.7% on capital) versus Austin's -$18,222 (-15.7% on capital). The difference comes down to three things: lower negative cash flow draining less capital, lower purchase price meaning less money at risk, and appreciation working on a base you can actually afford. The investor who puts $67K into Temple instead of $116K into Austin has $49K left over — enough for a down payment on a second Temple property, further compounding equity growth.
Can You Invest in Both Markets?
Yes — and sophisticated investors increasingly do. The "barbell strategy" pairs one Austin appreciation play with two or three Temple cash-flow properties, hedging both sides of the return equation. As of March 2026, here is how the math works with a $300K total investment budget:
Option A: All-Austin
$300K buys one property (using down payment + closing costs on a ~$415K home at $116K out of pocket). You get potential appreciation exposure but bleed -$1,814/month ($21,768/year). You are betting entirely on prices going up — and you need Austin to appreciate 5.3%+ annually just to offset the cash flow losses.
Option B: All-Temple
$300K covers down payments on four Temple properties at $240K each (~$67K per deal including closing). Annual cash flow will be negative on each (—$343/mo x 4 = —$1,372/mo), but the play is equity growth across four appreciating assets plus MTR optionality. Convert even one property to a furnished mid-term rental serving BSW travel nurses at $2,200–$2,500/month, and the entire portfolio can swing positive. You build equity across four assets, diversify tenant risk, and retain strategic flexibility Austin cannot offer at this capital level.
Option C: Barbell
Put $116K into an Austin property as a long-term appreciation bet (accept the -$1,814/mo negative cash flow as the cost of that bet). Put $184K into two or three Temple properties at $240K. The Temple properties lose less (-$343/mo each), and if you convert one to an MTR, the combined Temple cash flow can partially or fully offset the Austin losses. You maintain exposure to Austin's upside without the portfolio-level catastrophe of going all-in on a negative-leverage market.
The barbell approach is not theoretical — it is how institutional capital is increasingly flowing in Texas. As Austin-based investors face negative leverage (cap rates of 3.2–3.7% versus 6-month Treasury yields of 4.25%), capital migrates to secondary markets where the numbers actually work. Temple is a direct beneficiary of that migration.
Taylor's Take: An Honest Verdict from an Active Investor

I am going to be straight with you because that is what I would want if the roles were reversed.
Neither Austin nor Temple cash-flows positive on a traditional long-term rental at 6.75% interest rates with 25% down. Anyone telling you otherwise is either lying or using bad math. The real question is: which market loses less, requires less capital, and gives you more paths to eventually turn positive?
Austin bleeds -$1,814/month on a $415K property. Temple loses -$343/month on a $240K property. That is a $1,471/month difference — and you deploy $49K less capital to get the Temple deal done. Temple also gives you mid-term rental optionality that Austin largely does not: BSW travel nurses, data center construction crews, and military TDY tenants will pay $2,200–$2,500/month for a furnished 3-bed, which flips a -$343 deal to +$500 overnight.
I operate in Temple every day. I watch BSW nurses sign leases the week they are listed. I watch military families use their BAH to cover rent plus utilities with room to spare. This is not hype — it is demand I can see and quantify.
If you have $500K+ to deploy and a 10-year horizon, Austin might make sense as part of a broader portfolio — accept the bleed as a cost of appreciation exposure. If you have $60K–$200K and need a path to positive returns, Temple is where the math works. I invest here myself. That should tell you everything.
Call me and I will run the numbers on a specific property — not projections, not estimates, but real comps with real expenses. That is how you make decisions.
Austin vs Temple Investment Scorecard: Who Wins Each Round?
Here is the head-to-head across 10 categories that matter most to real estate investors. As of March 2026, Temple wins 7 of 10 rounds for the typical buy-and-hold investor.
| Category | Austin | Temple | Winner |
|---|---|---|---|
| Entry Price | $415K median | $240K entry | Temple |
| Cap Rate | 0.44% | 4.13% | Temple |
| Monthly Cash Flow | -$1,814 | -$343 | Temple |
| Property Tax Bill | $8,591/yr (2.07%) | $4,968/yr (2.07%) | Temple |
| Vacancy Rate | 10.2% | 5–7% | Temple |
| Tenant Demand Stability | Tech-dependent | Med / Military / Logistics | Temple |
| Appreciation Potential | Higher ceiling | Moderate, steady | Austin |
| Market Liquidity | 2.3M metro | ~96K city | Austin |
| Gov't-Backed Income | No BAH demand | $1,695–$2,070 BAH | Temple |
| Cost of Living (Tenants) | $2,749/mo (single) | 14% below national avg | Austin |
Final Score: Temple 7, Austin 3. Austin wins on appreciation ceiling, market liquidity, and tenant earning power. Temple wins everywhere that directly impacts an investor's bank account on a monthly basis.
Frequently Asked Questions: Austin vs Temple TX Real Estate Investment
Explore Temple TX Neighborhoods & Resources
Ready to Run the Numbers on a Specific Property?
I underwrite every deal with real comps, real expenses, and real projections — not best-case fantasies. Whether you are comparing Austin and Temple or ready to pull the trigger, let's talk numbers.
Taylor Dasch | EG Realty | License #0775435 | $27M+ in transactions
Search Temple TX Homes for Sale
2
3
4
5
6
7
8
9
10
11
12
13
14
15
16
17
18
19
20
21
22
23
24
25