


Best Neighborhoods to Invest in Temple TX
Zip-by-zip cap rates, rental yields, MTR vs LTR viability, HOA rental restrictions, and tenant demand data for every investor-grade neighborhood in Temple and Belton. Based on current MLS data and 100+ local investment deals.
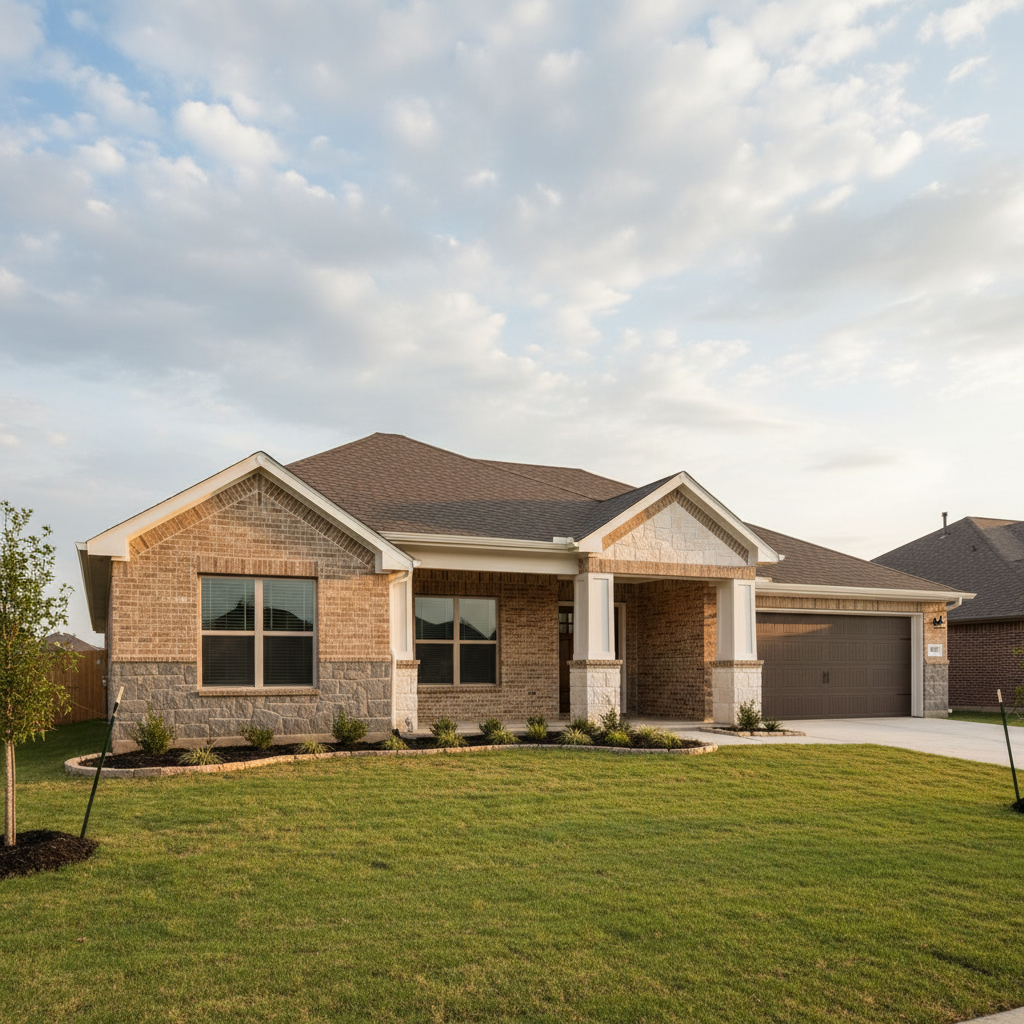
The best cash-flow neighborhood in Temple TX is the hospital district (76501) — pier-and-beam homes priced between $55K and $200K with gross yields above 7%. For newer construction with strong MTR demand, South Pointe (76504) and Prairie Ridge (76502) offer the best balance of tenant quality, yield, and low deferred maintenance. Belton (76513) is a pure appreciation play — yields compress below 6%, but vacancy runs under 4% because of Belton ISD demand. As of March 2026, per MLS and Bell County Appraisal District data.
- 76501 (Hospital District): Gross yield 7.21%, est. cap rate 3.96%, median price $232,895 — highest cash flow but highest foundation/flood risk
- 76502 (West Temple): Gross yield 6.56%, est. cap rate 3.60%, median price $310,000 — strongest MTR demand from BSW medical professionals
- 76504 (Central/North): Gross yield 6.79%, est. cap rate 3.73%, median price $228,854 — Meta data center driving contractor demand
- 76513 (Belton): Gross yield 5.95%, est. cap rate 3.27%, median price $361,500 — lowest vacancy (~4%) but worst cash flow
- Tenant base: 47% of Temple households rent. Vacancy rate 5.9%, below the 7.4% municipal target
- Section 8 arbitrage: HUD vouchers pay $178-$776/mo above market rent depending on zip code
How Do Cap Rates Compare Across Temple TX Zip Codes?
Estimated cap rates assume a 45% operating expense ratio, accounting for Temple's 2.36% effective property tax rate, 8% property management, 5% vacancy, and 5% maintenance/CapEx reserves. All data as of March 2026 per MLS and Bell County Appraisal District records.
Complete Zip Code Comparison
| Metric | 76501 East Temple | 76502 West Temple | 76504 Central/North | 76513 Belton |
|---|---|---|---|---|
| Median Home Price | $232,895 | $310,000 | $228,854 | $361,500 |
| Median Overall Rent | $1,399 | $1,695 | $1,295 | $1,795 |
| Avg 2BR Rent | $1,197 | $1,284* | $1,230* | $1,382 |
| Avg 3BR Rent | $1,550 | $1,686* | $1,425* | $1,713 |
| Avg 4BR Rent | $1,995 | $2,043* | $1,850* | $1,995 |
| Gross Rental Yield | 7.21% | 6.56% | 6.79% | 5.95% |
| Est. Cap Rate | 3.96% | 3.60% | 3.73% | 3.27% |
| Avg Days on Market | 87 | 99 | 115 | 99 |
| Rental DOM | 35-45 | 30-40 | 40-50 | 30-40 |
| 1-Year Appreciation | -12.12% | -2.52% | -15.21% | -0.82% |
| 3-Year Appreciation | +3.51% | -3.13% | Negative | -9.60% |
| Effective Tax Rate | 2.36% | 2.36% | 2.36% | 1.98% |
| Foundation Risk | Extreme | Moderate | High | Moderate |
| Flood Zone Exposure | ~12% of properties | Low | Low-Moderate | Low |
* Asterisked rents are blended metro estimates where zip-level sample sizes lacked statistical significance. Source: MLS, Bell County Appraisal District, TDHCA. Updated March 2026.
Why Is the Hospital District the Best Cash-Flow Play in Temple TX?
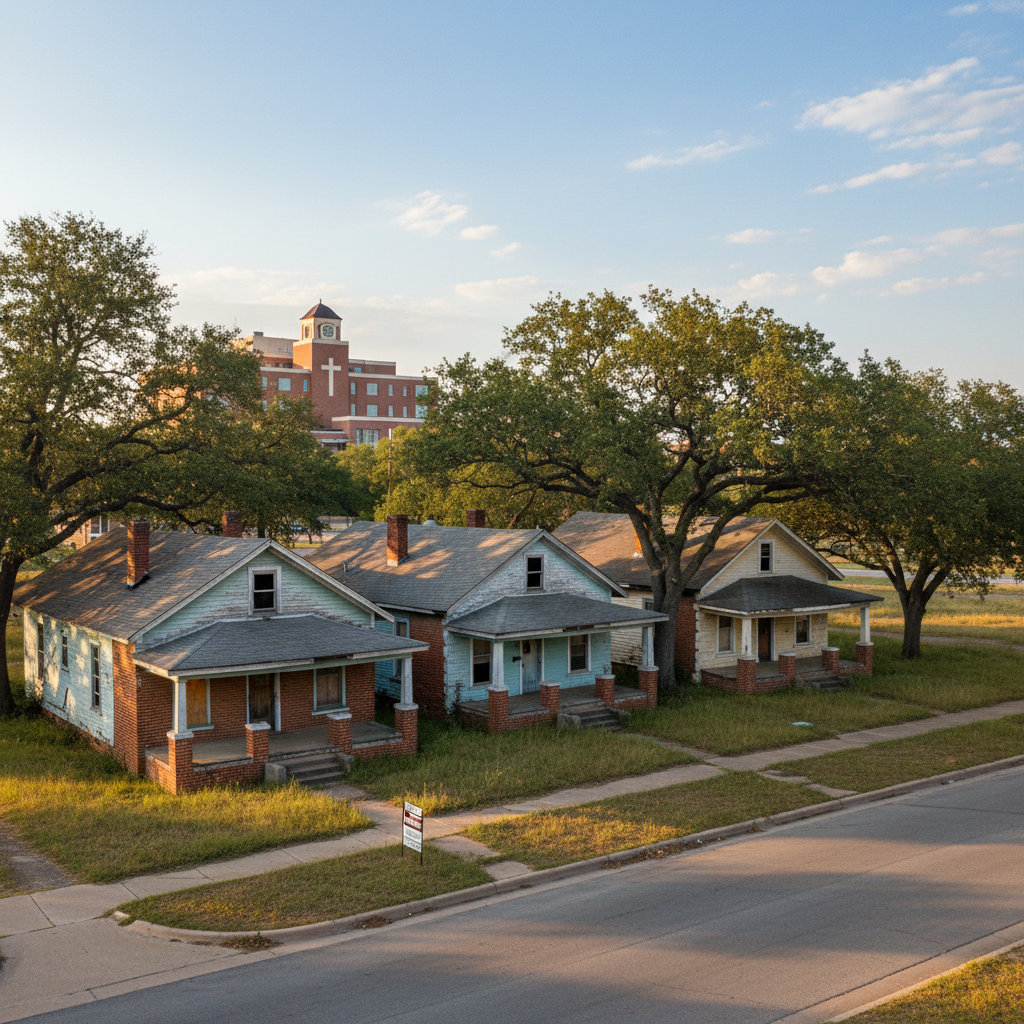
The hospital district — roughly bounded by S 3rd to S 55th Streets between Avenues L and R — holds the densest concentration of sub-$200K pier-and-beam and older slab homes within walking distance of Baylor Scott & White Medical Center. Per active MLS data, here is what the current inventory looks like:
| Address | Subdivision | List Price | Close Price | $/SqFt | SqFt | Year Built |
|---|---|---|---|---|---|---|
| 1301 S 13th St | Tal-Coe Place | $74,900 | $57,500 | $34 | 1,692 | 1952 |
| 1303 S 13th St | Tal-Coe Place | $54,900 | $30,000 | $51 | 592 | 1914 |
| 1017 S 21st St | Tal-Coe Place | $60,000 | $70,000 | $82 | 856 | 1915 |
| 912 S 1st St | Robertson | $53,000 | $37,000 | $25 | 1,480 | 1940 |
| 1214 S 19th St | Tal-Coe Place | $62,500 | — | $92 | 680 | 1935 |
| 309 W Ave P | Temple Original | $75,000 | — | $129 | 581 | 1923 |
| 1307 S 29th St | Tal-Coe Place | $67,800 | $71,000 | $57 | 1,248 | 1927 |
| 1001 S 29th St | Tal-Coe Place | $125,000 | $107,000 | $99 | 1,080 | 1962 |
| 1010 S 17th St | Tal-Coe Place | $90,000 | — | $98 | 920 | 1934 |
| 1020 S 23rd St | Tal-Coe Place | $159,900 | — | $186 | 860 | 1940 |
| 1201 S 21st St | Tal-Coe Place | $149,500 | — | $130 | 1,152 | 1980 |
| 1111 S 25th St | Tal-Coe Place | $175,000 | $160,000 | $80 | 2,002 | 1930 |
Source: Central Texas MLS, active and recently closed listings as of March 2026. Taylor Dasch personally closed 2 transactions in this dataset.
Hospital District: By the Numbers
What Drives Tenant Demand in Temple TX?
Temple's rental market is insulated from typical economic downturns by four recession-resistant demand engines. Understanding which tenants dominate each area determines your operational strategy and rent ceiling.
The Primary Engine
BSW is Temple's largest employer. Medical residents, attending physicians, traveling nurses, and clinical staff create continuous demand for both LTR and MTR housing, primarily in 76502 and the western corridors.
Key stat: 25% of MTR renters are healthcare professionals (Furnished Finder data)
Guaranteed BAH Income
Military families on PCS rotation seek 3-4BR homes in safe neighborhoods with strong school districts. BAH stipends provide predictable, government-backed rent. Belton and West Temple are primary targets.
Key stat: BAH ensures rent payment regardless of tenant employment changes
New Demand Wave
The Meta data center construction in South Temple has imported specialized contractors, engineers, and tech workers on 6-12 month assignments. This is driving immediate MTR demand in 76504 and southern 76502.
Key stat: 35% of MTR renters are business travelers on extended assignments
Student Housing Pipeline
UMHB in Belton drives rent-by-the-room models and 1-2BR demand concentrated near 76513. Steady turnover and consistent occupancy cycles, though rent ceilings are lower than professional tenants.
Key stat: Student demand targets lower price points but guarantees consistent occupancy
Should You Do MTR or LTR in Temple TX?
Mid-term rentals (30+ day furnished leases) command an average of $1,822/month for a studio or 1BR in Temple — a substantial premium over unfurnished LTR rates. But MTR viability varies drastically by neighborhood. Here is the breakdown, including HOA restrictions that could kill your strategy before it starts.
| Neighborhood | Zip | Typ. Price | Expected Rent | MTR | LTR | Primary Demand |
|---|---|---|---|---|---|---|
| South Pointe | 76504 | $230K-$300K | $1,700-$1,900 | Very High | High | Meta contractors, BSW staff |
| Prairie Ridge | 76502 | $248K-$275K | $1,975-$1,995 | High | High | BSW staff, VA Clinic staff |
| Wyndham Hill | 76502 | $250K-$300K | $1,635-$2,195 | High | High | Suburban renters, families |
| Three Creeks | 76513 | $300K-$400K | $1,800-$2,100 | Moderate | High | Fort Cavazos commuters |
| Hartrick Ranch | 76502 | $244K-$361K | $1,800-$2,200 | Moderate | High | Academy ISD families |
| Mesa Ridge | 76502 | $244K-$349K | $1,750-$1,900 | Moderate | High | Commuters, entry medical |
| Hills of Westwood | 76502 | $280K-$320K | $1,800-$2,195 | Moderate | Very High | Large families, military |
| Canyon Creek | 76502 | $239K-$241K | $1,500-$1,600 | Moderate | High | Working professionals |
| Lake Pointe | 76513 | $360K-$1.4M+ | $2,000-$4,600+ | Low | High | Executives, medical directors |
| Dawson Ranch | 76513 | $360K-$450K+ | $1,900-$2,200 | Low | High | Belton ISD families |
Source: MLS, Furnished Finder, HOA CC&R review. March 2026. For deeper analysis on each, visit our neighborhood guide.
“99 active furnished rentals on Furnished Finder in Temple, with 61 available. That is a growing market but not yet oversaturated — the MTR window is still open for operators who move now.”
Which Temple TX HOAs Restrict Rentals?
Texas Property Code Chapter 209 says an HOA cannot retroactively ban rentals unless it was in the original CC&Rs. But HOAs have other weapons. Short-term rentals under 30 days are commonly blocked by "residential use" clauses. Some communities cap investor-owned units to maintain FHA/VA financing eligibility. Always request and review the Master Declaration during the option period.
| Neighborhood | HOA Annual Cost | LTR Allowed? | MTR/STR Restrictions | Key Warning |
|---|---|---|---|---|
| Lake Pointe | High | Yes (6+ mo min) | No STR. MTR only 6+ months | Must notify property manager of tenant name |
| Dawson Ranch | Moderate | Yes | No STR. Single-family use only | Strict architectural guidelines |
| Canyon Creek | Moderate | Yes | Standard restrictions | Extremely strict landscape enforcement. Fines common. |
| Mesa Ridge | Moderate | Yes | Review phase declarations | D.R. Horton may cap leased unit % per phase for FHA/VA eligibility |
| South Pointe | ~$10/mo | Yes | Highly favorable | No PID. Low HOA. Investor-friendly. |
| Prairie Ridge | Low-Moderate | Yes | No known hard bans | Standard modern restrictions |
| Three Creeks | Moderate | Yes | Standard LTR framework | Bulk utility contracts affect lease structure |
| Hospital District | None | Yes | No restrictions | Zero HOA. Full rental freedom. STR, MTR, LTR all permitted. |
How Much More Does Section 8 Pay vs Market Rent in Temple TX?
HUD payment standards in Bell County frequently exceed open-market rents. This is one of the most overlooked yield-hacking strategies in Central Texas. The trade-off: housing authority inspections, bureaucratic friction, and potential tenant management complexity. The upside: government-backed rent that can be $776/month above market in the right zip code.
Market rent: $1,550
Market rent: $1,695
Market rent: $1,300
Market rent: insufficient data
Full HUD Payment Standard Table
| Zip Code | 2BR HUD Standard | 3BR HUD Standard | 4BR HUD Standard | Market 3BR Rent | Monthly Variance |
|---|---|---|---|---|---|
| 76501 | $1,236 | $1,728 | $2,088 | $1,550 | +$178 |
| 76502 | $1,692 | $2,352 | $2,844 | $1,695 | +$657 |
| 76503 | $1,416 | $1,968 | $2,376 | N/A | N/A |
| 76504 | $1,488 | $2,076 | $2,496 | $1,300 | +$776 |
Source: Texas Department of Housing and Community Affairs (TDHCA) 2025/2026 guidelines. Market rents from blended MLS median data.
What Are the Biggest Risks of Investing in Temple TX?
Every investor page that only shows upside is doing you a disservice. Here is the honest risk landscape for Temple and Belton real estate as of March 2026.
Expansive clay soil over shallow limestone bedrock causes cyclical swell/shrink that cracks slab foundations and disrupts pier-and-beam structures. Budget a minimum 5% of gross rent for CapEx reserves. In 76501 and 76504, commission a structural engineer's report during every option period. Not optional.
Every zip code in Temple shows negative 1-year appreciation: -0.82% (Belton) to -15.21% (76504). This is driven by massive new construction inventory flooding the market. Short-term equity plays do not work here right now. Forced appreciation via rehab is the only path to quick equity.
Approximately 12% of downtown and East Temple (76501) properties fall within FEMA Flood Zone AE. Mandatory flood insurance on financed properties crushes NOI. Check FEMA maps before making an offer — even properties one block apart can have drastically different flood classifications.
Average homeowners insurance: $1,861/year, spiking to $2,683 for $350K dwelling coverage. The effective property tax rate of 2.36% in Temple is among the highest in the corridor. Combined, these eat 30-40% of gross rent before maintenance. Belton's slightly lower rate (1.98%) provides marginal relief.
Where Can You Buy Duplexes and Quadplexes in Temple TX?
For investors looking beyond single-family, the Saulsbury area in central Temple has the densest concentration of small multi-family inventory — duplexes and quadplexes at accessible price points. These properties offer multiple income streams from a single acquisition, reducing per-unit risk.
Saulsbury Area Multi-Family Overview
The Saulsbury neighborhood sits in the 76501/76504 corridor and features 2-4 unit buildings built primarily between the 1940s and 1970s. Purchase prices for duplexes typically range from $80K to $180K. Quadplexes, when they surface, run $150K to $300K depending on condition and occupancy.
The trade-offs are the same as hospital district SFH: older construction, foundation risk, and tenants who require active management. But the per-door economics can be significantly better than SFH at similar price points. No HOA restrictions. Full rental strategy freedom.
- Investors looking for turnkey, zero-maintenance assets at sub-5% cap rates (buy an index fund)
- Out-of-state buyers who will not visit the property before closing
- Anyone who thinks the hospital district is "easy money" without understanding foundation risk
- Investors underwriting 5%+ annual rent increases in their pro formas (not happening here in 2026)
- Buyers seeking short-term flip profits — appreciation is negative across all zip codes right now

I have closed over 100 investment deals in this market personally — flips, BRRRR, mid-term rentals, buy-and-hold. So when I tell you where the best returns are, I am speaking from P&L statements, not theory.
The best cash-flow play in Temple is the hospital district. Pier-and-beam homes, cheaper entry points, prime location near BSW with strong rental demand. You can acquire properties for $55K-$150K, put in $15K-$40K of rehab, and rent them for $900-$1,400/month. The math works if you buy right and manage the foundation risk.
The best neighborhoods for investors overall are the hospital district, Cimarron, and the historic district. These areas give you price-to-rent ratios that actually cash flow after real expenses — not the theoretical cash flow you see on Zillow calculators.
One area I actively avoid: the east side, specifically the south even-numbered streets. The tenant quality drops, the property condition deteriorates, and the rental demand does not justify the headache. The numbers might look good on a spreadsheet, but the operational reality is different.
For newer construction investors who do not want rehab risk, South Pointe is where I would point you. $10/month HOA, no PID, and you are 10 minutes from BSW and the Meta data center. That is your MTR play.
Frequently Asked Questions About Investing in Temple TX Neighborhoods
More Investor Resources
These pages go deeper on specific topics referenced above. Each one is built for investors, not casual browsers.